RESULTS / CASE STUDIES

Results Must Be Measurable—and Traceable

Each result is linked to the site, equipment, pre-deployment baseline, observation period and measurement method, providing a consistent basis for before-and-after comparison.

HOW WE VERIFY

A Consistent Measurement Process from Baseline to Improvement Result

Pre- and post-deployment operating data are compared under consistent conditions, with traceable measurement and supporting records.

01

CASE ID

Create a unique case identifier to prevent data from different versions or sites from being mixed.

02

BASELINE

Define the pre-deployment baseline and comparable operating conditions.

03

OBSERVATION

Record the deployment date, observation period and changes in conditions during that period.

04

MEASUREMENT

Document measurement criteria, tools, locations, frequency and comparison methods.

05

SUPPORTING DATA

Compile photographs, records, bills, equipment data and other supporting materials.

06

RESULTS

State the improvement result, applicable conditions, limitations and calculation boundary.

APPLICATION AREAS

Define Relevant Result Indicators for Each Application

Measurement items are defined according to the equipment, load, environment and operating conditions. Actual results are based on site-specific before-and-after comparisons.

WATER & SYSTEM EFFICIENCY

Water-System / Heat-Exchange Applications

Evaluate water quality, scale, heat-transfer efficiency, flow and equipment operation.

SITE-SPECIFIC MEASUREMENT
ENERGY OPTIMIZATION

Corporate Electricity-System Applications

Compare electricity use, load, operating hours and production conditions to identify improvement opportunities.

BASELINE + M&V
THERMAL MANAGEMENT

Equipment Thermal-Management Applications

Compare surface temperature, ambient conditions, equipment load, heat-dissipation performance and related energy use.

COMPARABLE CONDITIONS
Molecular-hydrogen applications require technology assessment and compliance criteria appropriate to the product category, equipment conditions and target market.
SELECTED CASE EVIDENCE

Show not only results, but also what the evidence can actually support

These public cases have passed the Evidence Gate. Evidence types are not interchangeable; energy, carbon and economic outcomes are published only when matching measurement data exists.
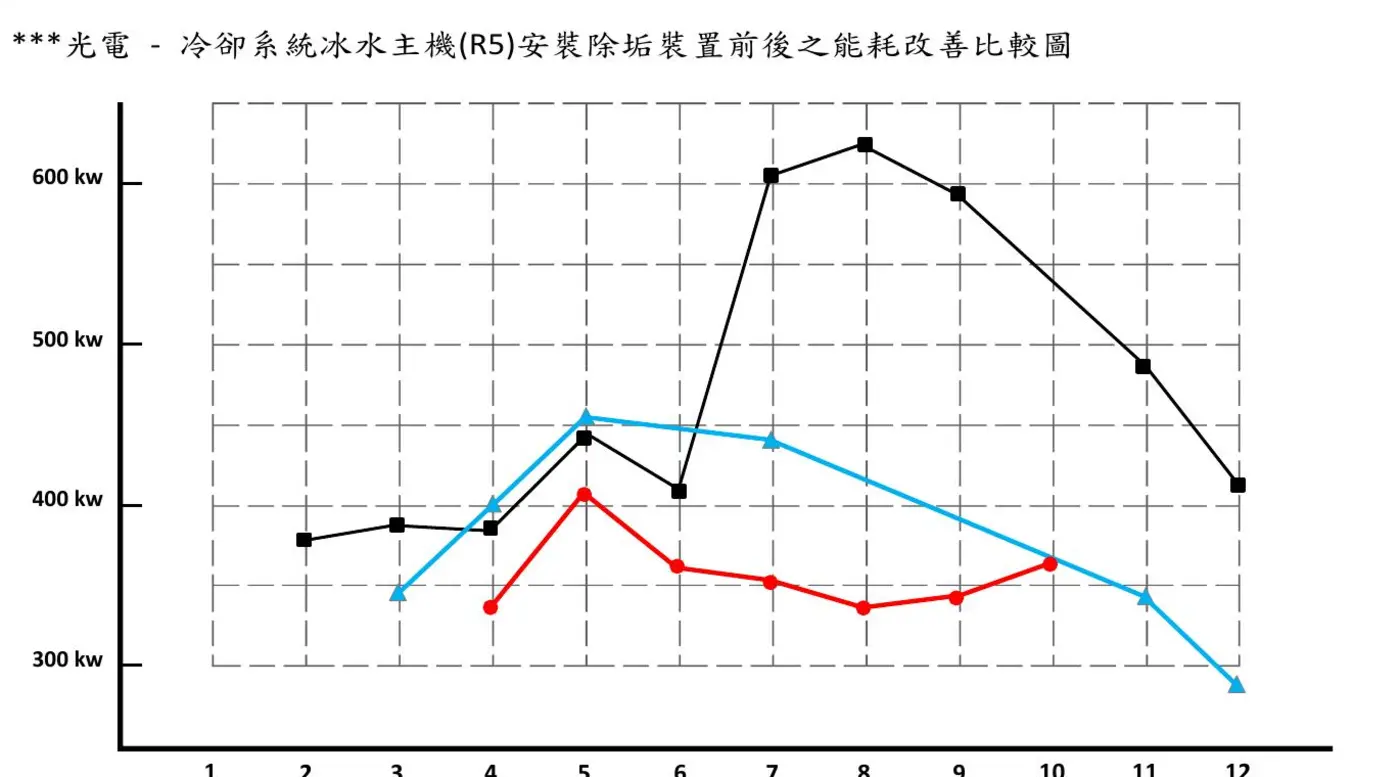
SEGO-C-001SOURCE DATA · MULTI-YEAR

Solar-related company | long-term cooling-system tracking

Solar-related company | long-term cooling-system tracking
DEPLOYMENT
Source records show the descaling device was installed and started in November 2010.
EVIDENCE
Historical records cover chiller energy use, colony count, conductivity and iron trends across multiple years.
BOUNDARY
Missing months and operating-condition differences are retained in the interpretation. Source-reported analysis values are not presented as verified or guaranteed results.
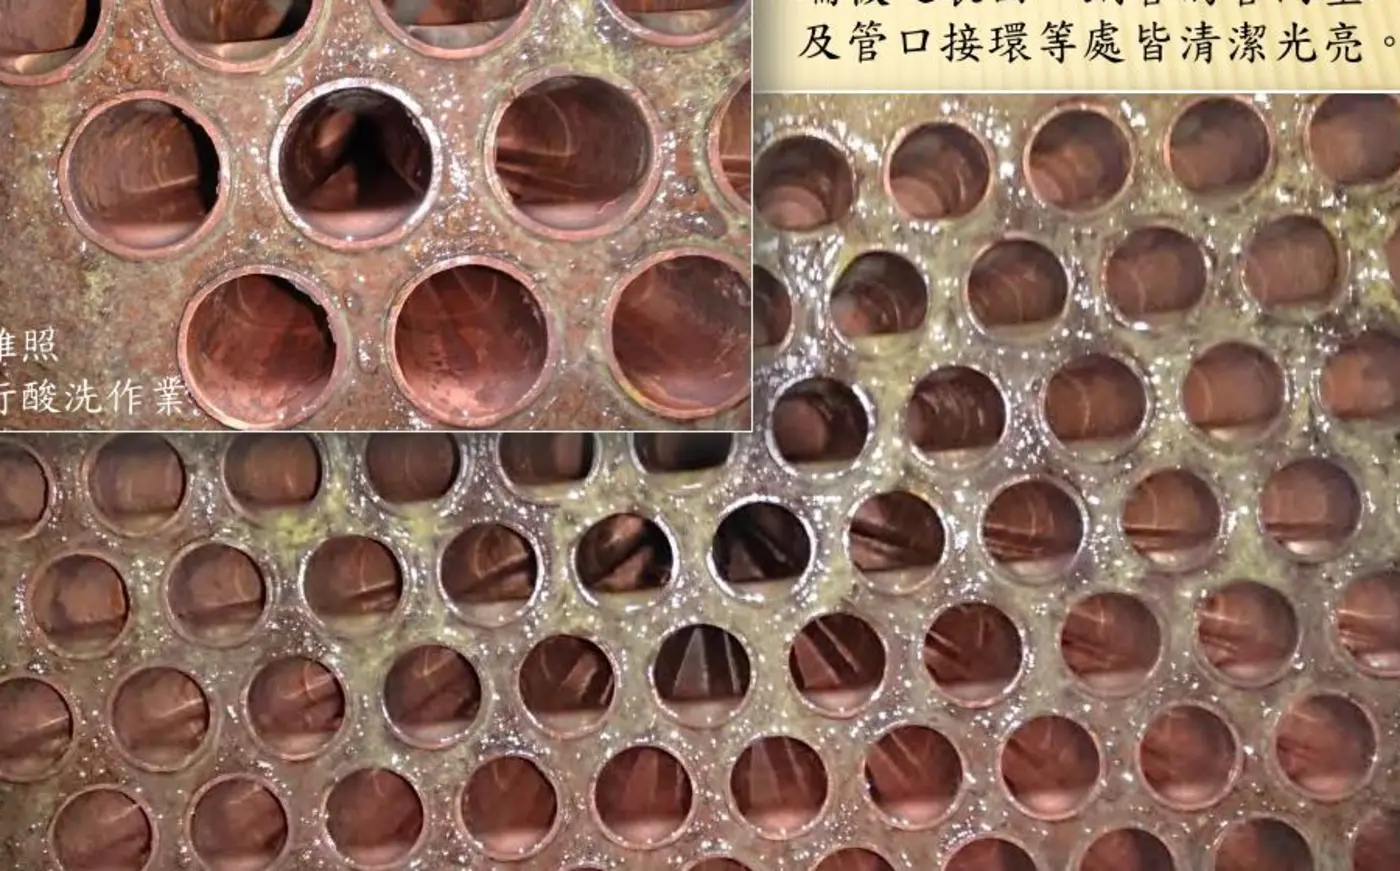
SEGO-CH-001SITE INSPECTION

400 / 800 RT chillers | water-side open inspection

400 / 800 RT chillers | water-side open inspection
DEPLOYMENT
The 800 RT unit was opened after 38 days; source records note no water rinse or acid wash before inspection. The 400 RT unit was opened after four months, with scale fragments recorded in the Y-strainer.
EVIDENCE
Evidence consists of site records of opened equipment, end plates / tube surfaces and recovered material.
BOUNDARY
Site inspection does not support universal claims such as no acid wash, a fixed energy-saving rate, COP improvement or longer equipment life.
SEGO-CT-001VISUAL TIME SERIES

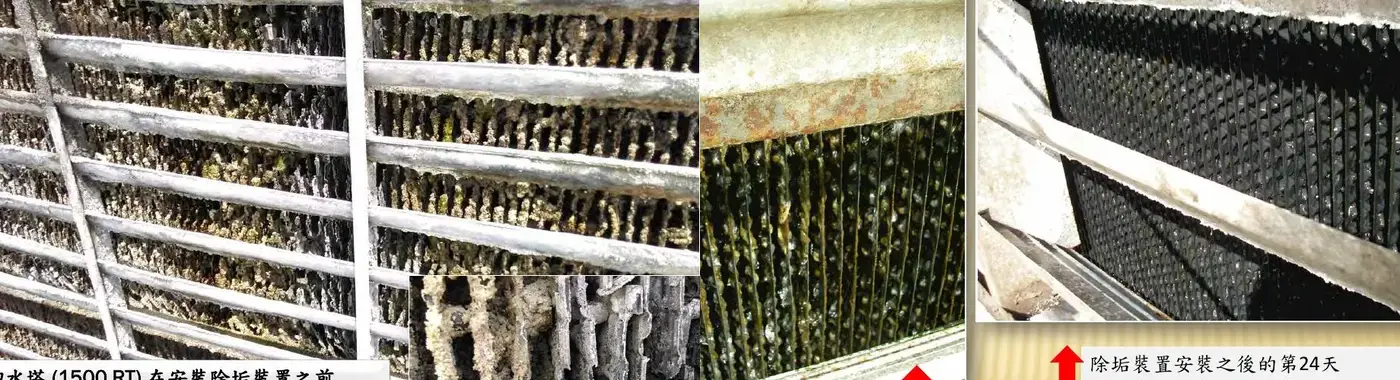
1500 / 6500 RT cooling towers | scale-condition changes

1500 / 6500 RT cooling towers | scale-condition changes
DEPLOYMENT
The 1500 RT case preserves Before → 45 Days → Water Rinse. The 6500 RT case preserves Before → Day 4 → Day 24.
EVIDENCE
The visual time series supports description of visible fin and deposit conditions only.
BOUNDARY
Photos are not energy measurements; no energy, carbon or economic result is inferred from images.
SEGO-B-001PHYSICAL EVIDENCE

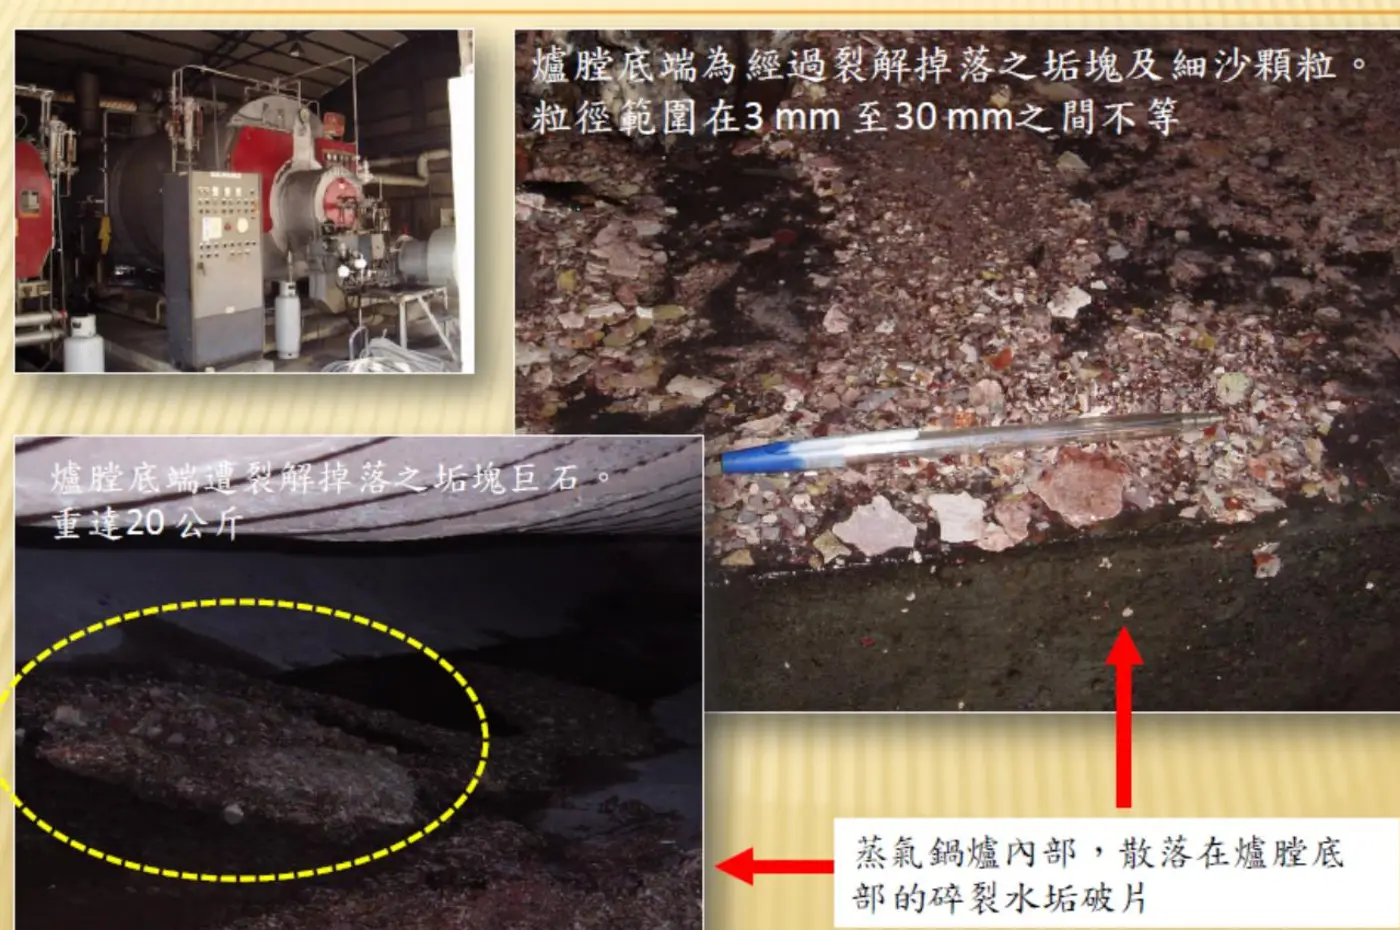
Large steel plant in Northeast China | industrial-boiler scale shedding

Large steel plant in Northeast China | industrial-boiler scale shedding
DEPLOYMENT
Anonymous large steel plant in Northeast China; source records show visible scale fragments and discharged material, including outlet fragments of about 3–8 mm.
EVIDENCE
Evidence consists of physical / image records of scale fragments, furnace-bottom deposits and discharged material.
BOUNDARY
Market-ranking language and generic boiler-savings estimates are not attributed to this case.
SEGO-H-001SITE VISUAL · CHILLER INSPECTION

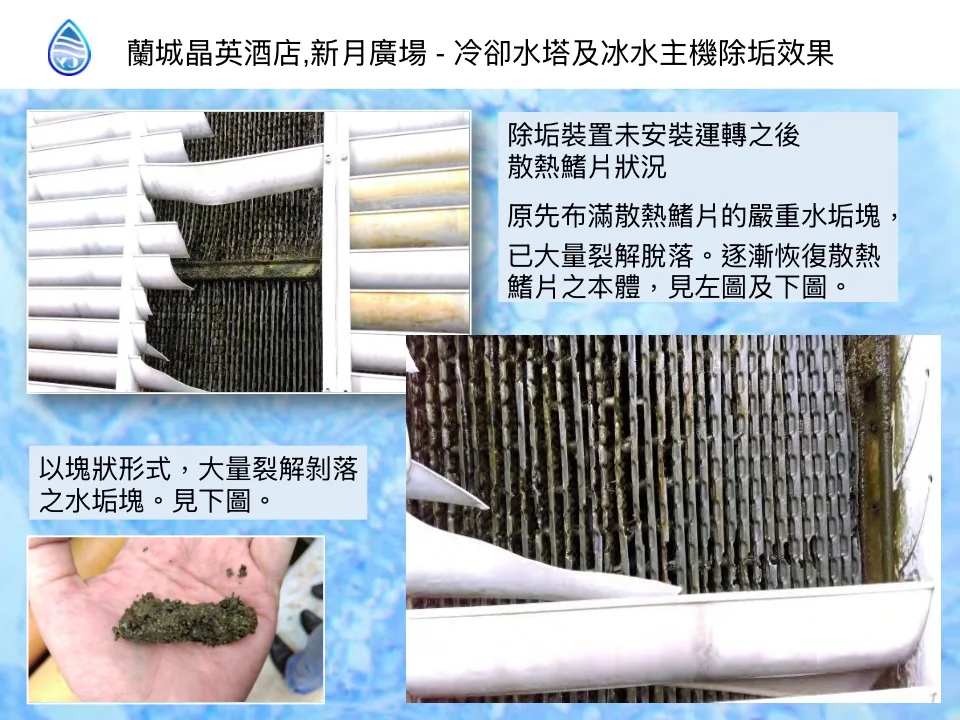
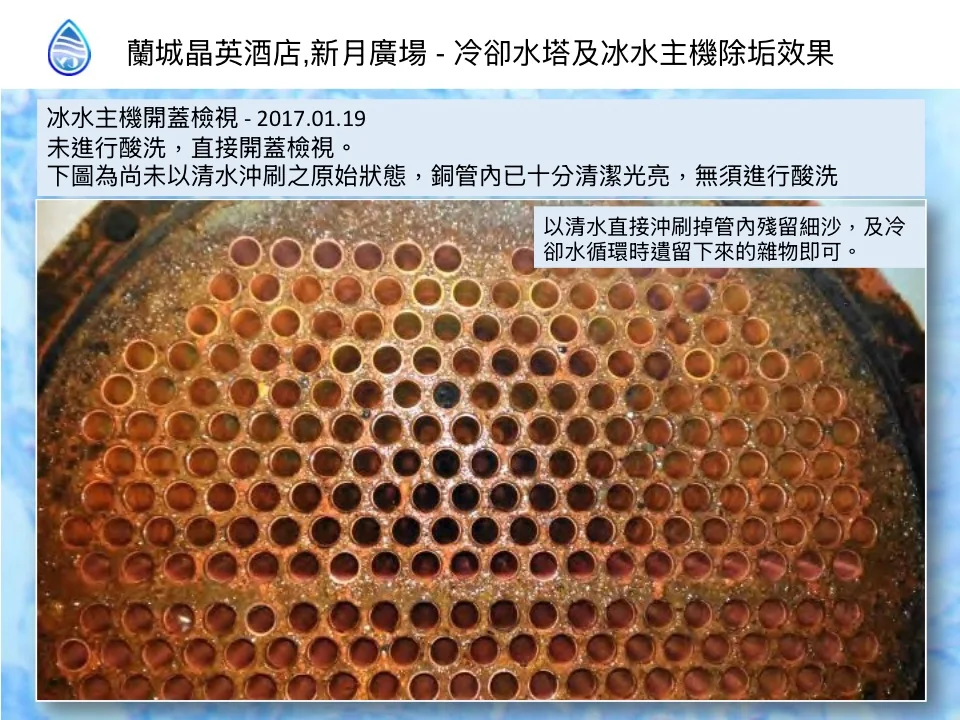
Silks Place Yilan & Luna Plaza | Cooling Tower and Chiller Inspection

Silks Place Yilan & Luna Plaza | Cooling Tower and Chiller Inspection
CHALLENGE
Visible scale and deposits were recorded on cooling-tower fins, with an additional chiller opening inspection documented in the same case set.
OBSERVATION
Images show portions of scale cracking and detaching during operation, progressively exposing the fins. On 2017-01-19, the chiller was opened without acid cleaning and before water rinsing; the copper tubes already appeared clean and bright.
EVIDENCE
9600 RT cooling-tower overview, fin close-ups, detached scale and chiller copper-tube opening images.

Evidence note: site images support visible condition and change only. They are not used to infer a fixed energy-saving rate, CO₂ reduction, payback period or other unmeasured performance.

EVIDENCE BOUNDARYApproved case images and provided cases may be published within their approved scope. Performance data remains evidence-controlled. Restricted client data remains excluded from the public website.
WHAT A COMPLETE RESULT CONTAINS

Key Information Included in a Complete Result

A consistent data structure explains the improvement and provides a basis for comparison and traceability.

Site and Equipment Industry, system, capacity and operating context
Pre-Deployment Baseline Comparison basis and original condition
Deployed Technology Configuration, date and applicable scope
Observation Period Start and end dates and comparable conditions
Measurement Method Tools, locations, frequency and calculation approach
Before / After Traceable pre- and post-deployment data and images
Measured Results Only results directly supported by measurement
Economic Benefits Calculation assumptions, period and currency
Carbon Impact Requires separate emission factors, boundaries and methods
Result Context Applicable conditions, limitations and calculation boundary
FROM SITE DATA TO VERIFIED VALUE

Start with a Pre-Deployment Baseline and Build Comparable Improvement Results

Define measurement items, comparison conditions and data sources before deployment so later results have a clear and consistent basis for interpretation.

OUR BRAND SPIRIT

Better for People.
Better for the Planet.

Connecting measurable technology improvements with business value and environmental sustainability.